remote cpu monitoring using node-kstat
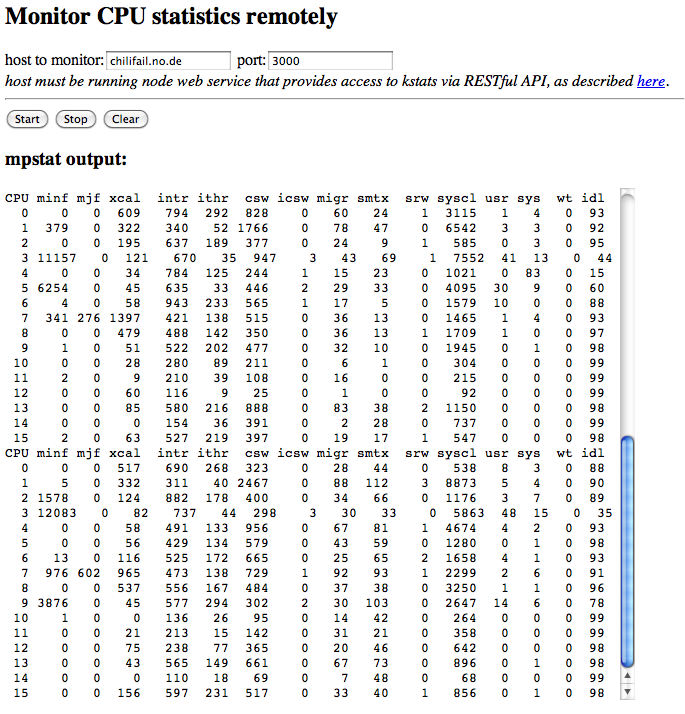
The node-kstat add-on module for node.js allows you to poll specific system kstats from within node, and get back a nice array of objects with keys corresponding to the various kstat fields (like what you get from the kstat(1) command). Bryan’s repository also includes an example of the mpstat(1) command written in JavaScript that utilizes the node-kstat add-on. Given the ease with which you can implement web services using node (and supporting libraries), I thought I’d try exposing the kstat facility as a RESTful web service, and re-tool the mpstat example to run in the browser as a client.
Part 1: Exposing a kstat web service
Thanks to the express framework for node, this turned out to be the easiest part of the exercise. I wanted to expose roughly the same API as the node-kstat Reader() constructor method (which takes kstat class, module, name, and instance – all optional), but I also wanted to allow multiple kstats to be specified (within a single module). The reason for this is that mpstat(1) consumes 2 kstats (cpu::sys and cpu::vm), and I didn’t want to have to make multiple HTTP requests for each round of output from the mpstat client. I settled on the following API for my web service:
http://server.example.com:port/kstats/module/instance/name
The ‘module’ field is required and must match a single kstat module. The ‘instance‘ field may be an integer of a single instance, or the ‘*’ wildcard to indicate all instances. The ‘name‘ field may be one or more kstat names separated by semicolons. So, the URI needed to gather the 2 kstats consumed by mpstat ends up being:
http://server.example.com:port/kstats/cpu/*/vm;sys
The web service responds with JSON. The response contains an object for each of the named kstats (vm and sys), each of which contains an array with one element per CPU instance.
Here’s all the code for the kstat web service:
var express = require('express');
var kstat = require('kstat');

var app = module.exports = express.createServer();

// Routes

app.get('/kstats/:module/:instance/:name', function(req, res){

        var filter = {};

        filter["module"] = req.params.module;

        if (req.params.instance ==! '*')
                filter["instance"] = parseInt(req.params.instance, 10);

        //handle multiple semicolon-separated values for stat 'name'
        var stats = req.params.name.split(';');

        var results = {};

        var reader = {};

        for (var i=0; i < stats.length; i++) {
                var stat = stats[i];

                filter["name"] = stat;

                reader[stat] = new kstat.Reader(filter);

                results[stat] = reader[stat].read();
        }

        // Set response header to enable cross-site requests
        res.header('Access-Control-Allow-Origin', '*');

        res.send(results);

});

// Only listen on $ node app.js

if (!module.parent) {
  app.listen(3000);
  console.log("kstat server listening on port %d", app.address().port);
}
Part 2: porting mpstat.js to the browser
I really didn’t have to change much to the original server-side mpstat.js to get it working in the browser as a client to the kstat web service. The big change was to make it event-driven so I could use the Ajax model for making HTTP requests and responding to HTTP response events. To do this, I added an update_kstats() function for the HTTP response handler to call. Rather than having the mpstat object push output, I added a method to retrieve the current output from the object’s internal state.
The modified mpstat.js code (renamed mpstat_init.js) can be viewed here.
The Ajax page that includes the above mpstat_init.js can be viewed here.
(Edit: Live Demo no longer available)
Part 3: adding some flare
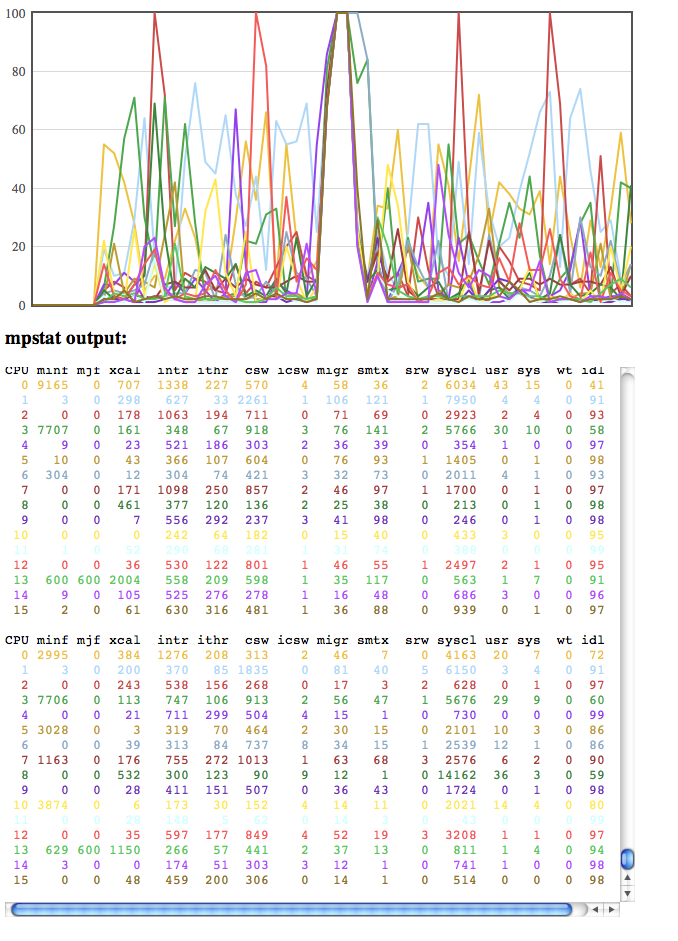
If you’re like most people, you like using your visual cortex to process data. Since we are running JavaScript in the browser anyway, why not take a page from the cloud analytics book, and use flot to graph some of the data we’re getting from mpstat? In the example below, I’m graphing individual CPU utilization (usr + sys columns) per-cpu, and I’m color-coding the mpstat output with the graph. The only change needed to the mpstat module was to add a method for retrieving the current output state in object form rather than lines of text (so it could be fed to the graphing library).
Source for the Ajax page (which uses the flot library) can be found here.
(Edit: Live Demo no longer available)
(Edit: 3/23/13 Source for the demo is available in a self-contained express app hosted here: https://github.com/mharsch/mpstat-browser.)

